ดัชนีราคาทาวน์โฮมพร้อมที่ดิน เป็นตัวชี้วัดสำคัญของตลาดอสังหาริมทรัพย์แนวราบในกรุงเทพฯ และปริมณฑล ทาวน์โฮมตอบโจทย์ ครอบครัวขนาดเล็ก-กลาง ที่ต้องการบ้านราคาย่อมเยาแต่สะดวกต่อการเดินทาง
แนวโน้มดัชนี 2554-2568
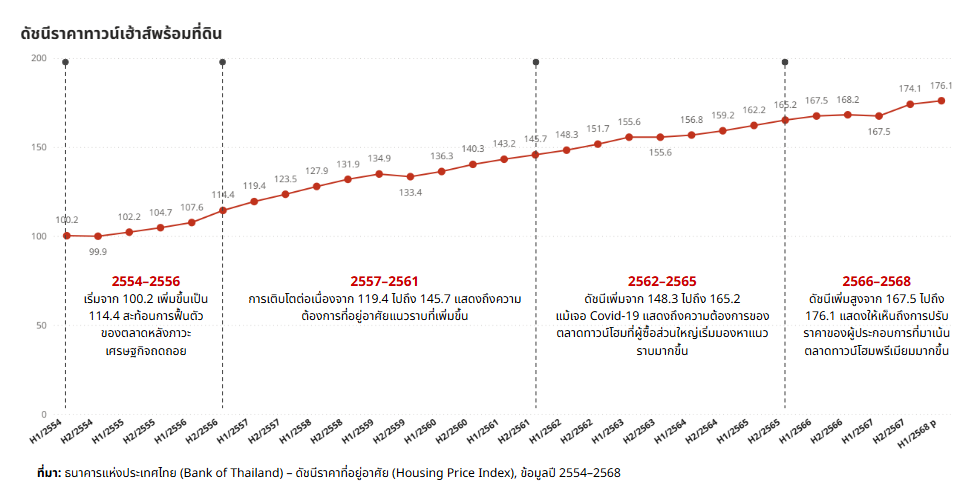
จากข้อมูลปี 2554 ถึง ปี 2568 พบว่า ดัชนีมีการเปลี่ยนแปลงดังนี้
- 2554-2556: เริ่มจาก 100.2 เพิ่มขึ้นเป็น 114.4 สะท้อนการฟื้นตัวของตลาดหลังภาวะเศรษฐกิจถดถอย
- 2557-2561: การเติบโตต่อเนื่องจาก 119.4 ไปถึง 145.7 แสดงถึงความต้องการที่อยู่อาศัยแนวราบที่เพิ่มขึ้น
- 2562-2565: ดัชนีเพิ่มจาก 148.3 ไปถึง 165.2 แม้เจอโควิด-19 แสดงถึงความต้องการของตลาดทาวน์โฮมที่ผู้ซื้อส่วนใหญ่เริ่มมองหาแนวราบมากขึ้น
- 2566-2568: ดัชนีเพิ่มสูงจาก 167.5 ไปถึง 176.1 แสดงให้เห็นถึงการปรับราคาของผู้ประกอบการที่มาเน้นตลาดทาวน์โฮมพรีเมียมมากขึ้น
ภาพรวม:
ดัชนีราคาปรับขึ้น 76% ใน 14 ปี การเติบโตสูงกว่าบ้านเดี่ยว แสดงให้เห็น ความนิยมทาวน์โฮมในกลุ่มครอบครัวที่ต้องการบ้านราคาย่อมเยา ใกล้เมือง และเดินทางสะดวก
ที่มา: ธนาคารแห่งประเทศไทย (Bank of Thailand) - ดัชนีราคาที่อยู่อาศัย (Housing Price Index), ข้อมูลปี 2554-2568
Townhome Price Index in Bangkok and Metropolitan Area (2011-2025)
The Townhome Price Index is a key indicator of medium-sized horizontal housing in Bangkok and its metropolitan area. Townhomes are popular among small to medium-sized families seeking affordable, convenient homes close to urban centers.
From H1/2011 to H1/2025 (preliminary):
- 2011-2013: Increased from 100.2 → 114.4 as the market recovered post-economic slowdown. Boosted by improved housing loans and supportive banking policies.
- 2014-2018: Growth continued from 119.4 → 145.7, reflecting expansion to meet the needs of Gen Y families and middle-to-upper income buyers seeking accessible yet affordable homes.
- 2019-2022: Increased from 148.3 → 165.2 despite COVID-19. Buyers adapted by choosing smaller homes, secondary locations, or waiting for promotions.
- 2023-2025: Stabilized around 167.5 → 176.1. Demand remains, though buyers are more cautious and prioritize value over size.
Source: Bank of Thailand (BOT) - Housing Price Index (2011–2025)